Reference
How to View a Spectrogram: Nyquist Frequency and Sample Rate for Every Format
Every verdict on this site comes down to three numbers: the Nyquist frequency (the highest frequency a file can physically store), the measured peak frequency (the highest frequency it actually contains), and the ratio between them. Learn to read those three on a spectrogram and you can judge any audio file in seconds no trust in labels required. This is the reference article for that skill. First the theory, briefly and in plain language. Then a master table covering every format the analyzer supports MP3, AAC, M4A, Ogg Vorbis, Opus, FLAC, ALAC, WAV, and AIFF and then one section per format with its expected spectrogram and the numbers that define it. One spoiler up front: every genuine lossless file looks identical, so the four lossless formats share a single reference image the point is what they don't show.
Nyquist frequency, in sixty seconds
Digital audio stores a waveform as snapshots samples taken tens of thousands of times per second. The sample rate is how many snapshots per second: 44,100 for CD audio, 48,000 for video-era audio, 96,000 for hi-res. A fundamental result of signal processing (the Nyquist–Shannon sampling theorem) says a sampled signal can represent any frequency up to half the sample rate and nothing above it. That half is the Nyquist frequency:
| Sample rate | Nyquist frequency | Where you meet it |
|---|---|---|
| 44.1 kHz | 22.05 kHz | CD, most music files |
| 48 kHz | 24 kHz | Video, broadcast, many downloads |
| 88.2 kHz | 44.1 kHz | Hi-res (2× CD rate) |
| 96 kHz | 48 kHz | Hi-res, studio sessions |
| 192 kHz | 96 kHz | Top-tier hi-res |
Try to encode a frequency above Nyquist and it doesn't get dropped it gets misrepresented as a false lower frequency, an artifact called aliasing. So every honest recording chain filters content above Nyquist out before sampling. Nyquist is a hard ceiling built into the physics of the file itself.
Measured peak, and the ratio that judges a file
The measured peak frequency is what the analyzer finds when it sweeps the decoded audio: the highest frequency with sustained, real energy (single clicks and brief artifacts don't count content has to persist). Divide one by the other and you get the peak-to-Nyquist ratio: ratio = measured peak frequency ÷ Nyquist frequency The ratio is the whole game because it normalizes across sample rates. A genuine CD rip at 44.1 kHz measures a peak near 22 kHz ratio ≈ 1.0. A fake made from a 128 kbps MP3 measures \~16 kHz ratio ≈ 0.73. That same fake resampled to 96 kHz still measures 16 kHz, but now against a 48 kHz ceiling ratio ≈ 0.33, even more damning. The number travels with the audio's true history while every label on the file insists otherwise. One caveat before the format tour: a ratio below 1.0 is evidence, not an automatic verdict. Old tape masters, deliberately filtered productions, and lo-fi recordings legitimately lack top-end content. What separates them from lossy transcodes is the shape of the cutoff gradual and music-following versus ruler-straight which is exactly what the spectrogram shows and a bare number can't.
How to view a spectrogram
A spectrogram is three pieces of information flattened into a picture: time runs left to right, frequency runs bottom to top, and energy is shown as color bright where the sound is loud at that frequency and moment, dark where there's nothing. Reading one is a four-step habit. First, find the top of the frequency axis that's the Nyquist ceiling for the file's sample rate. Second, find where the bright content stops that's the measured peak. Third, look at how it stops: a ragged edge that breathes with the music is natural roll-off; a level shelf that never moves is an encoder's lowpass filter. Fourth, scan the region above the cutoff genuine files keep faint dither noise up there; lossy transcodes show mathematically empty black. That last step is the one beginners skip and veterans never do. "Quiet up top" and "empty up top" are completely different findings, and they look completely different once you've seen both.
The master table: every format at a glance
Everything below in one place. "Typical ceiling" means where a well-made file of that format usually tops out at its common bitrates; the ratio assumes a 44.1 kHz source (Nyquist 22.05 kHz) unless noted.
| Format | Type | Typical ceiling | Healthy ratio |
|---|---|---|---|
| MP3 128k | Lossy | \~16 kHz | \~0.73 |
| MP3 192k | Lossy | \~18–18.5 kHz | \~0.83 |
| MP3 320k | Lossy | \~20–20.5 kHz | \~0.92 |
| AAC 128k | Lossy | \~16–17 kHz | \~0.75 |
| AAC 256k | Lossy | \~19–20 kHz | \~0.89 |
| HE-AAC 32–64k | Lossy | full band (synthesized) | \~1.0\* |
| Ogg Vorbis q5–q8 | Lossy | \~18–20 kHz | \~0.85–0.92 |
| Opus 128–256k | Lossy | \~20 kHz (48 kHz rate) | \~0.83 |
| FLAC | Lossless | Nyquist | ≈1.0 |
| ALAC (.m4a) | Lossless | Nyquist | ≈1.0 |
| WAV / AIFF | Lossless (raw PCM) | Nyquist | ≈1.0 |
\*HE-AAC's ratio is meaningless by design its upper band is synthesized by the decoder, not stored in the file. The section below explains how to spot it anyway.
MP3 (.mp3)
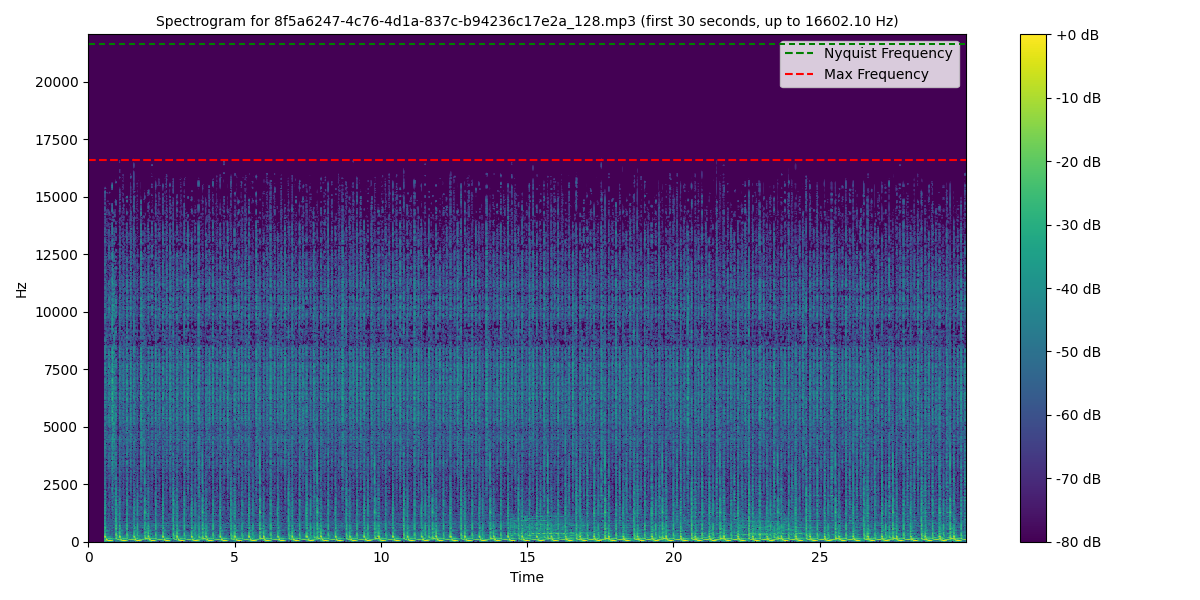
The format everyone owns and the one with the most predictable spectrogram. MP3's lowpass filter is a direct function of bitrate: at 128 kbps expect a hard shelf near 16 kHz (ratio ≈ 0.73); at 192 kbps around 18–18.5 kHz (≈ 0.83); at 320 kbps around 20–20.5 kHz (≈ 0.92). LAME's V0 VBR preset behaves like \~256 kbps with a 19.5 kHz ceiling. Two reading tips specific to MP3. A CBR file's cutoff is dead level for the whole track same bit budget every frame, so the filter never moves. A VBR file's cutoff steps: it nudges upward during dense passages and settles back on quiet ones, drawing a visible staircase along the shelf. That stepping is VBR announcing itself, and it's useful corroboration when the header numbers look odd. The full diagnostic method lives in the MP3 guide.
AAC and M4A (.aac, .m4a)
Two things before the numbers. First, M4A is a container, not a codec an .m4a holds either AAC (lossy) or ALAC (lossless), and the extension can't tell you which. Check the codec field; the analyzer reports it first. Second, AAC earns a higher ceiling than MP3 at the same bitrate: roughly 16–17 kHz at 128 kbps and 19–20 kHz at 256 kbps, the Apple Music standard. Judging AAC by MP3's table is the most common spectrogram misreading there is. One nuance that trips people up: an AAC spectrogram can show occasional flickers of energy right up near Nyquist a burst during a cymbal crash, a transient spike in a loud passage while the file remains unmistakably lossy. That's the encoder's bit reservoir at work: when a loud moment arrives, AAC temporarily reallocates bits upward and lets a little content through above its usual shelf before clamping back down. What you're looking for is not "does any pixel ever light up near 22 kHz" but "is there sustained content up there." A genuine lossless file keeps the top band alive continuously, even in quiet passages, because dither noise never stops. A lossy file shows dark gaps between the bursts and its sustained ceiling still sits at the AAC bitrate's shelf. The analyzer's measured peak uses the persistence rule for exactly this reason. The format's party trick is HE-AAC, used at 32–64 kbps for streams and podcasts: the encoder stores only the lower spectrum plus compact instructions, and the decoder synthesizes the upper band by reshaping the lower one. The spectrogram looks full ratio ≈ 1.0 at a bitrate that couldn't possibly store those frequencies. The tells: a horizontal texture seam at the SBR crossover (usually 8–12 kHz), an upper band that mirrors patterns below it, and the absurd bitrate itself. More in the AAC/M4A guide.
When lossy files reach near Nyquist and stay lossy
This deserves its own section because it's the single most common cause of a wrong "it looks full, must be lossless" call. Several lossy codecs routinely put some energy in the top octave, and none of it means what a beginner hopes:
- Transient bursts. As in the AAC example above, loud moments earn temporary bit allocations that reach high. Burst-then-dark is lossy; sustained is lossless.
- Synthesized bands. HE-AAC's SBR (and similar tricks elsewhere) generate top-octave content at decode time. It looks continuous, but it's a copy of the low band check for the crossover seam and mirrored texture.
- Full-band-by-design codecs. Opus and high-quality Vorbis preserve nearly all of the audible band at moderate bitrates, so the cutoff test barely applies. Here the bitrate and provenance carry the verdict instead.
- Encoder noise shaping. Some encoders push quantization noise into the least-audible region the top of the band leaving a faint, uniform haze up there. Haze is not content: it's flat, textureless, and identical in character from second to second, unlike music's structure.
The unifying rule: judge the sustained ceiling and the texture, not the brightest single pixel. Ask three questions is the top band alive continuously, does it have musical structure (harmonics that track the content below), and does it match the claimed bitrate? A file that lights up near Nyquist only in flashes, or with a copy-paste texture, or at 48 kbps, is lossy wearing altitude.
Ogg Vorbis (.ogg)
Vorbis the codec in most .ogg files is MP3's open-source contemporary and the longtime standard for games and older streaming tiers. At typical music bitrates (q5 ≈ 160 kbps, q8 ≈ 256 kbps) it cuts around 18–20 kHz, ratio ≈ 0.85–0.92. At its highest quality settings it can leave content above 20 kHz, which makes the cutoff test weaker here than with MP3. The distinctive Vorbis spectrogram trait is the cutoff's softness. Where MP3 draws a ruler line, Vorbis's floorplan noise shaping produces a slightly feathered edge that can wobble a few hundred hertz with the music. Don't mistake that softness for natural roll-off the emptiness above the edge is still total, and total emptiness is still the lossy signature. Also note the container: .ogg can technically hold other codecs (Opus included), so confirm the codec field before applying these numbers.
Opus (.opus)
The newest codec here and the one that breaks the old rules. Opus is spectacularly efficient transparent for most listeners by 128–160 kbps and, crucially for spectrogram readers, it preserves the full audible band at moderate bitrates. Where MP3 spends bits removing the top of the spectrum, Opus's SILK/CELT hybrid design keeps content running to 20 kHz even at 96–128 kbps. Two quirks to know before judging an Opus file. First, Opus always decodes at 48 kHz the format's internal rate so Nyquist is 24 kHz, and a healthy file reaching 20 kHz shows a ratio around 0.83 rather than the 0.9x you'd expect at 44.1 kHz. Don't flag that as suspicious; it's the format working as designed. Second, and this is the caution from the section above in its purest form: an Opus spectrogram can look almost full-band and still be a 96 kbps lossy file. The codec is simply that good at keeping the audible spectrum alive. So with Opus, the cutoff test steps aside and the other evidence takes over the reported bitrate, the source you got the file from, and the knowledge that a 128 kbps Opus is a fine listening copy but still not an archive. We currently do not support Opus files for this reason, but the analyzer will eventually include them.
FLAC (.flac)
FLAC is lossless, so there's no encoder lowpass to find the spectrogram should show content right up to the Nyquist ceiling with a ragged, music-following edge. At 44.1 kHz that's a peak near 22.05 kHz and a ratio ≈ 1.0; at 96 kHz, genuine hi-res material shows something usually noise and harmonics above 22 kHz into the 48 kHz range. And here's the thing that makes lossless formats easy: they all look the same. A genuine FLAC, a genuine ALAC, a genuine WAV, and a genuine AIFF of the same recording are bit-identical at the sample level, so their spectrograms are pixel-identical too content to the ceiling, ragged edge, ratio at practically 1.00. One reference image serves all four, which is why this article shows exactly one lossless spectrogram:
Which means a lossless container's spectrogram is a lie detector for its history, not its format. A shelf at 16 kHz says the file is a transcoded 128 kbps MP3 wearing a lossless wrapper; an empty band above 22.05 kHz in a 96 kHz file says it was upsampled from CD rate. Bitrate corroborates: genuine 44.1 kHz FLACs run \~700–1,000 kbps, and a transcode compresses suspiciously well because the encoder already removed the detail FLAC would otherwise spend bits on. The full five-clue method is in the FLAC verification guide.
ALAC (.m4a)
Apple's lossless codec lives in the same .m4a container as AAC, so the first check is always the codec field: alac means lossless, aac or mp4a means lossy. Once you've confirmed ALAC, apply exactly the FLAC expectations content to Nyquist, ragged edge, ratio ≈ 1.0, and a bitrate in the 700–1,000 kbps range for 44.1 kHz stereo. The failure mode to watch is the "upgraded" iTunes library: AAC purchases or low-bitrate imports batch-converted to ALAC by someone who believed conversion restores quality. The ALAC faithfully preserves the AAC's 19.5 kHz shelf, the file quadruples in size, and nothing is gained. The spectrogram catches it the same way it catches fake FLAC the container upgraded; the audio didn't. And when the file is genuine, it looks exactly like the lossless reference image above because it is exactly that audio.
WAV (.wav)
WAV is raw PCM with a header no compression, no codec tricks, nothing between you and the samples. The spectrogram expectation is pure Nyquist: at 44.1 kHz, content to 22.05 kHz; at 96 kHz, content that actually uses the 48 kHz range. The catch is that WAV's honesty as a container makes it the preferred hiding place for dishonest audio: an upscaled or transcoded file saved as WAV is "technically lossless" forever after. The three failure signatures, each covered in depth in the WAV guide: a 96 kHz file whose spectrum stops dead at 22.05 kHz (upsampled from CD rate ratio drops to ≈ 0.46); a 24-bit file whose noise floor bottoms out at −96 dBFS (padded from 16-bit); and the classic lossy shelf with its empty band above (transcoded from MP3 or AAC). Every number in a WAV's header is arithmetic, not evidence the spectrum is the only witness. A clean WAV is, once again, the same picture as the lossless reference above.
AIFF (.aiff, .aif)
AIFF is WAV with a different header Apple's container instead of Microsoft's holding the same raw PCM. Everything from the WAV section applies unchanged: content should reach Nyquist, the ratio should sit near 1.0, and all three failure modes (upsampling, bit-depth padding, lossy transcodes) look identical on the spectrogram because they are identical at the sample level. The practical difference is ecosystem, not analysis: AIFFs cluster in Mac-centric production workflows, so the format shows up often in sample libraries, DJ pools, and bounced project files contexts where a "production-ready" file may quietly have lossy ancestors. Same suspicion, same checks, same verdicts and the same lossless reference image when the file is clean.
Putting it into practice
The workflow, once the theory is in hand, takes under a minute per file. Drop the file into the analyzer and note the sample rate that sets the Nyquist ceiling. Read the measured peak frequency and the ratio. Then, if anything looks off, tick the spectrogram box and check the shape of the top edge: ragged and breathing is music, level and lifeless is an encoder. Cross-reference the ceiling against the master table above to name the likely source codec, and check the debug log attached to every result if you want to see exactly which measurements produced the verdict. After a dozen files the pattern recognition becomes automatic the shelf of a 128 kbps past is as recognizable as a fingerprint. And if you want to audit an entire library rather than one file at a time, the open-source version runs the same analysis in batch over whole folders.
Frequently asked questions
Can a file exceed its Nyquist frequency? No content above Nyquist can't be represented; attempting it produces aliasing, false tones folded back below the ceiling. Recording chains filter above-Nyquist content out before sampling precisely to prevent that. If a file seems to show energy above half its sample rate, what you're seeing is an analysis artifact or a misreported sample rate, not real ultrasonics. Does a ratio of 1.0 prove a file is lossless? It proves the top of the spectrum is occupied no more. HE-AAC synthesizes a full-looking band at 48 kbps, and high-quality Opus and Vorbis reach high enough that the ratio alone can't convict them. The ratio is the first filter, not the final verdict; cutoff shape, bitrate, compression ratio, and provenance complete the picture. Why do some genuine files stop at 20 kHz? Because some masters do. Deliberate lowpassing during production, bandwidth-limited vintage recordings, and certain microphone chains all produce honest 20 kHz ceilings. The distinguishing marks are the gradual, music-following edge and the faint noise persisting above it both visible on the spectrogram, neither visible in a bare ratio. What about WMA, WavPack, or DSD files? The analyzer focuses on the nine formats above, which cover the overwhelming majority of files in circulation. WavPack and Monkey's Audio follow FLAC's expectations when lossless; DSD is a different physics entirely (1-bit, megahertz rates, shaped ultrasonic noise) and doesn't fit the Nyquist-ratio framework at all. The glossary covers the terminology for the longer tail.
The takeaway
Nyquist is the ceiling the format allows; the measured peak is what the file actually delivers; the ratio divides one by the other; and the spectrogram shows whether the gap was made by music or by an encoder. Four ideas, one minute per file, and no label gets the last word ever again.
Try to encode a frequency above Nyquist and it doesn't get dropped — it gets misrepresented as a false lower frequency, an artifact called aliasing. So every honest recording chain filters content above Nyquist out before sampling. Nyquist is a hard ceiling built into the physics of the file itself.
Measured peak, and the ratio that judges a file
The measured peak frequency is what the analyzer finds when it sweeps the decoded audio: the highest frequency with sustained, real energy (single clicks and brief artifacts don't count — content has to persist). Divide one by the other and you get the peak-to-Nyquist ratio:
ratio = measured peak frequency ÷ Nyquist frequency
The ratio is the whole game because it normalizes across sample rates. A genuine CD rip at 44.1 kHz measures a peak near 22 kHz — ratio ≈ 1.0. A fake made from a 128 kbps MP3 measures ~16 kHz — ratio ≈ 0.73. That same fake resampled to 96 kHz still measures 16 kHz, but now against a 48 kHz ceiling — ratio ≈ 0.33, even more damning. The number travels with the audio's true history while every label on the file insists otherwise.
One caveat before the format tour: a ratio below 1.0 is evidence, not an automatic verdict. Old tape masters, deliberately filtered productions, and lo-fi recordings legitimately lack top-end content. What separates them from lossy transcodes is the shape of the cutoff — gradual and music-following versus ruler-straight — which is exactly what the spectrogram shows and a bare number can't.
How to view a spectrogram
A spectrogram is three pieces of information flattened into a picture: time runs left to right, frequency runs bottom to top, and energy is shown as color — bright where the sound is loud at that frequency and moment, dark where there's nothing.
Reading one is a four-step habit. First, find the top of the frequency axis — that's the Nyquist ceiling for the file's sample rate. Second, find where the bright content stops — that's the measured peak. Third, look at how it stops: a ragged edge that breathes with the music is natural roll-off; a level shelf that never moves is an encoder's lowpass filter. Fourth, scan the region above the cutoff — genuine files keep faint dither noise up there; lossy transcodes show mathematically empty black.
That last step is the one beginners skip and veterans never do. "Quiet up top" and "empty up top" are completely different findings, and they look completely different once you've seen both.
The master table: every format at a glance
Everything below in one place. "Typical ceiling" means where a well-made file of that format usually tops out at its common bitrates; the ratio assumes a 44.1 kHz source (Nyquist 22.05 kHz) unless noted.
| Format | Type | Typical ceiling | Healthy ratio |
|---|---|---|---|
| MP3 128k | Lossy | ~16 kHz | ~0.73 |
| MP3 192k | Lossy | ~18–18.5 kHz | ~0.83 |
| MP3 320k | Lossy | ~20–20.5 kHz | ~0.92 |
| AAC 128k | Lossy | ~16–17 kHz | ~0.75 |
| AAC 256k | Lossy | ~19–20 kHz | ~0.89 |
| HE-AAC 32–64k | Lossy | full band (synthesized) | ~1.0* |
| Ogg Vorbis q5–q8 | Lossy | ~18–20 kHz | ~0.85–0.92 |
| Opus 128–256k | Lossy | ~20 kHz (48 kHz rate) | ~0.83 |
| FLAC | Lossless | Nyquist | ≈1.0 |
| ALAC (.m4a) | Lossless | Nyquist | ≈1.0 |
| WAV / AIFF | Lossless (raw PCM) | Nyquist | ≈1.0 |
*HE-AAC's ratio is meaningless by design — its upper band is synthesized by the decoder, not stored in the file. The section below explains how to spot it anyway.
MP3 (.mp3)
The format everyone owns and the one with the most predictable spectrogram. MP3's lowpass filter is a direct function of bitrate: at 128 kbps expect a hard shelf near 16 kHz (ratio ≈ 0.73); at 192 kbps around 18–18.5 kHz (≈ 0.83); at 320 kbps around 20–20.5 kHz (≈ 0.92). LAME's V0 VBR preset behaves like ~256 kbps with a 19.5 kHz ceiling.
Two reading tips specific to MP3. A CBR file's cutoff is dead level for the whole track — same bit budget every frame, so the filter never moves. A VBR file's cutoff steps: it nudges upward during dense passages and settles back on quiet ones, drawing a visible staircase along the shelf. That stepping is VBR announcing itself, and it's useful corroboration when the header numbers look odd. The full diagnostic method lives in the MP3 guide.
AAC and M4A (.aac, .m4a)
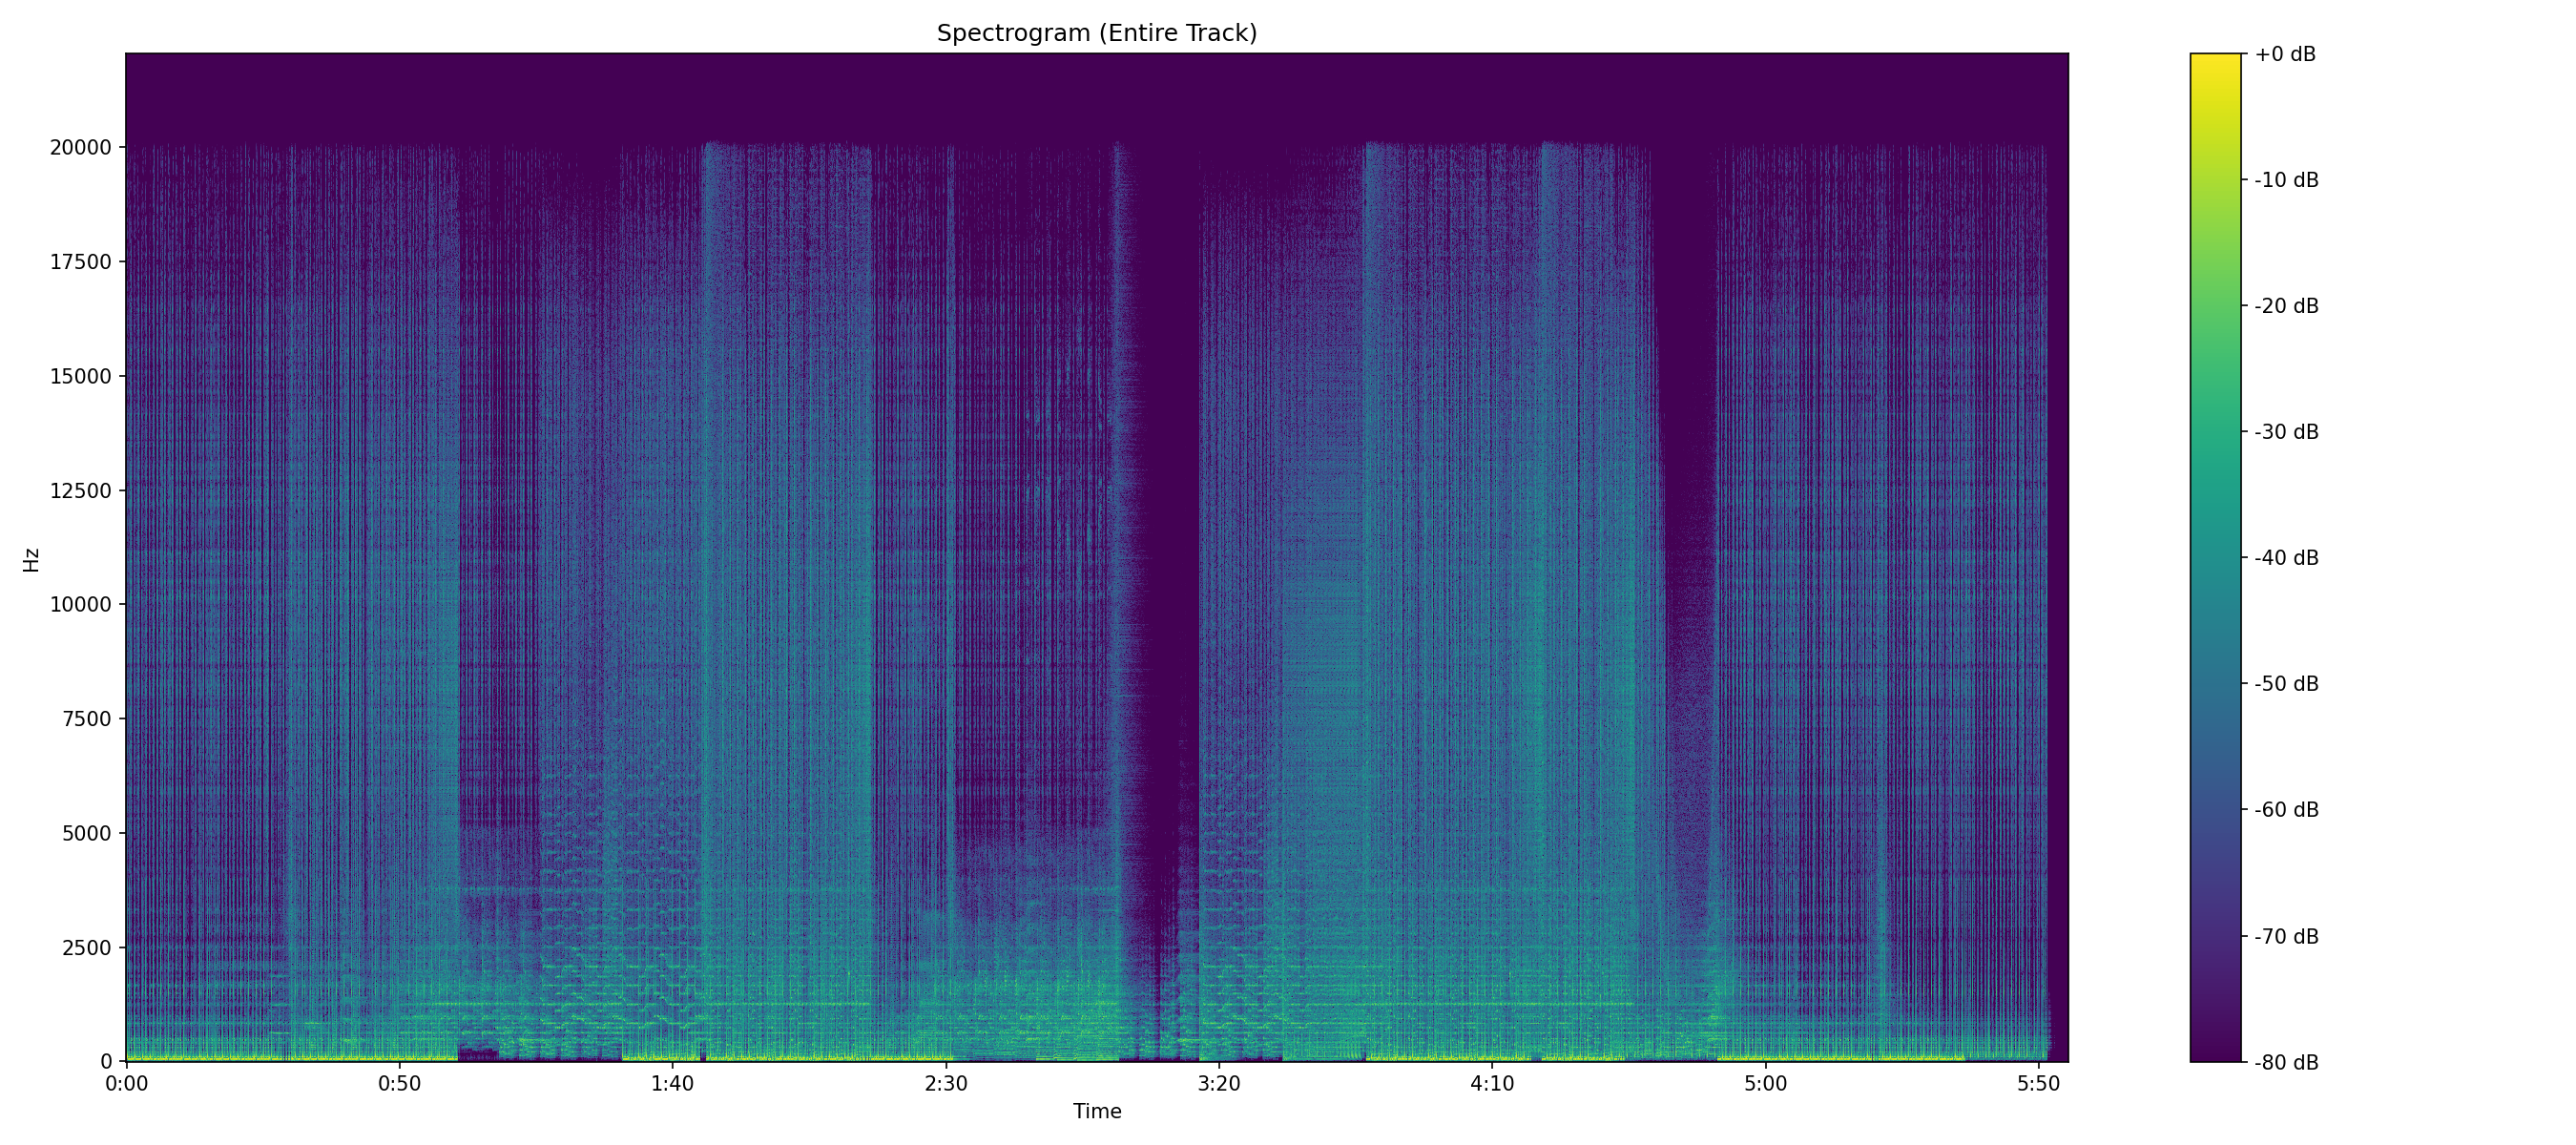
Two things before the numbers. First, M4A is a container, not a codec — an .m4a holds either AAC (lossy) or ALAC (lossless), and the extension can't tell you which. Check the codec field; the analyzer reports it first. Second, AAC earns a higher ceiling than MP3 at the same bitrate: roughly 16–17 kHz at 128 kbps and 19–20 kHz at 256 kbps, the Apple Music standard. Judging AAC by MP3's table is the most common spectrogram misreading there is.
One nuance that trips people up: an AAC spectrogram can show occasional flickers of energy right up near Nyquist — a burst during a cymbal crash, a transient spike in a loud passage — while the file remains unmistakably lossy. That's the encoder's bit reservoir at work: when a loud moment arrives, AAC temporarily reallocates bits upward and lets a little content through above its usual shelf before clamping back down. What you're looking for is not "does any pixel ever light up near 22 kHz" but "is there sustained content up there." A genuine lossless file keeps the top band alive continuously, even in quiet passages, because dither noise never stops. A lossy file shows dark gaps between the bursts — and its sustained ceiling still sits at the AAC bitrate's shelf. The analyzer's measured peak uses the persistence rule for exactly this reason.
The format's party trick is HE-AAC, used at 32–64 kbps for streams and podcasts: the encoder stores only the lower spectrum plus compact instructions, and the decoder synthesizes the upper band by reshaping the lower one. The spectrogram looks full — ratio ≈ 1.0 — at a bitrate that couldn't possibly store those frequencies. The tells: a horizontal texture seam at the SBR crossover (usually 8–12 kHz), an upper band that mirrors patterns below it, and the absurd bitrate itself. More in the AAC/M4A guide.
When lossy files reach near Nyquist — and stay lossy
This deserves its own section because it's the single most common cause of a wrong "it looks full, must be lossless" call. Several lossy codecs routinely put some energy in the top octave, and none of it means what a beginner hopes:
- Transient bursts. As in the AAC example above, loud moments earn temporary bit allocations that reach high. Burst-then-dark is lossy; sustained is lossless.
- Synthesized bands. HE-AAC's SBR (and similar tricks elsewhere) generate top-octave content at decode time. It looks continuous, but it's a copy of the low band — check for the crossover seam and mirrored texture.
- Full-band-by-design codecs. Opus and high-quality Vorbis preserve nearly all of the audible band at moderate bitrates, so the cutoff test barely applies. Here the bitrate and provenance carry the verdict instead.
- Encoder noise shaping. Some encoders push quantization noise into the least-audible region — the top of the band — leaving a faint, uniform haze up there. Haze is not content: it's flat, textureless, and identical in character from second to second, unlike music's structure.
The unifying rule: judge the sustained ceiling and the texture, not the brightest single pixel. Ask three questions — is the top band alive continuously, does it have musical structure (harmonics that track the content below), and does it match the claimed bitrate? A file that lights up near Nyquist only in flashes, or with a copy-paste texture, or at 48 kbps, is lossy wearing altitude.
Ogg Vorbis (.ogg)
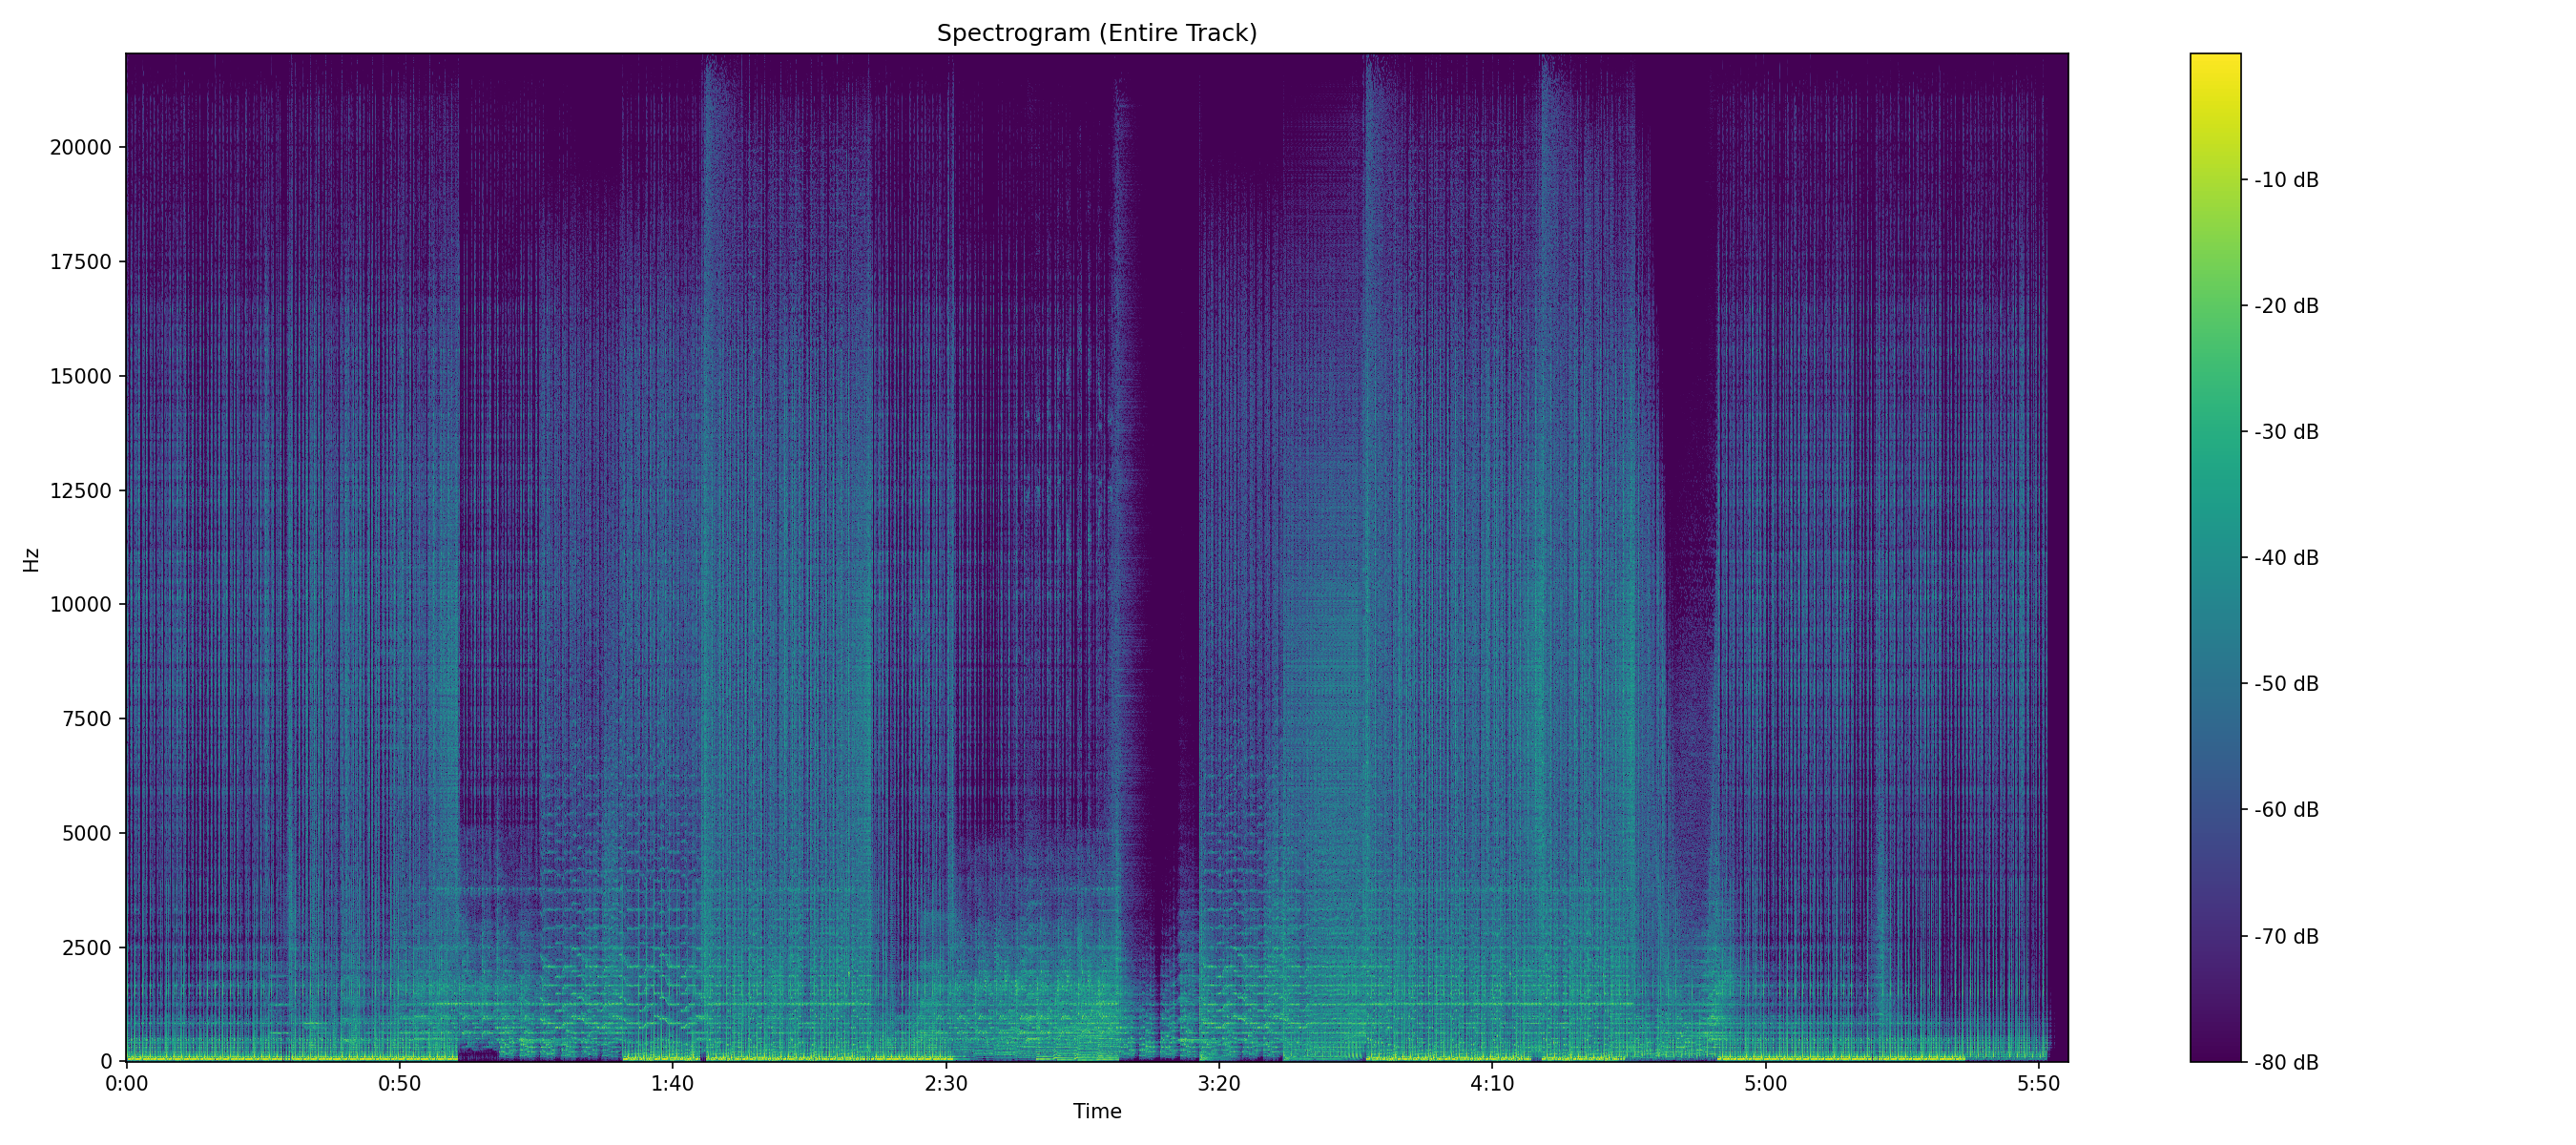
Vorbis — the codec in most .ogg files — is MP3's open-source contemporary and the longtime standard for games and older streaming tiers. At typical music bitrates (q5 ≈ 160 kbps, q8 ≈ 256 kbps) it cuts around 18–20 kHz, ratio ≈ 0.85–0.92. At its highest quality settings it can leave content above 20 kHz, which makes the cutoff test weaker here than with MP3.
The distinctive Vorbis spectrogram trait is the cutoff's softness. Where MP3 draws a ruler line, Vorbis's floorplan noise shaping produces a slightly feathered edge that can wobble a few hundred hertz with the music. Don't mistake that softness for natural roll-off — the emptiness above the edge is still total, and total emptiness is still the lossy signature. Also note the container: .ogg can technically hold other codecs (Opus included), so confirm the codec field before applying these numbers.
Opus (.opus)
The newest codec here and the one that breaks the old rules. Opus is spectacularly efficient — transparent for most listeners by 128–160 kbps — and, crucially for spectrogram readers, it preserves the full audible band at moderate bitrates. Where MP3 spends bits removing the top of the spectrum, Opus's SILK/CELT hybrid design keeps content running to 20 kHz even at 96–128 kbps.
Two quirks to know before judging an Opus file. First, Opus always decodes at 48 kHz — the format's internal rate — so Nyquist is 24 kHz, and a healthy file reaching 20 kHz shows a ratio around 0.83 rather than the 0.9x you'd expect at 44.1 kHz. Don't flag that as suspicious; it's the format working as designed. Second, and this is the caution from the section above in its purest form: an Opus spectrogram can look almost full-band and still be a 96 kbps lossy file. The codec is simply that good at keeping the audible spectrum alive. So with Opus, the cutoff test steps aside and the other evidence takes over — the reported bitrate, the source you got the file from, and the knowledge that a 128 kbps Opus is a fine listening copy but still not an archive. We currrently do not support Opus files due to these complexities, but the analyzer will eventually include them.
FLAC (.flac)
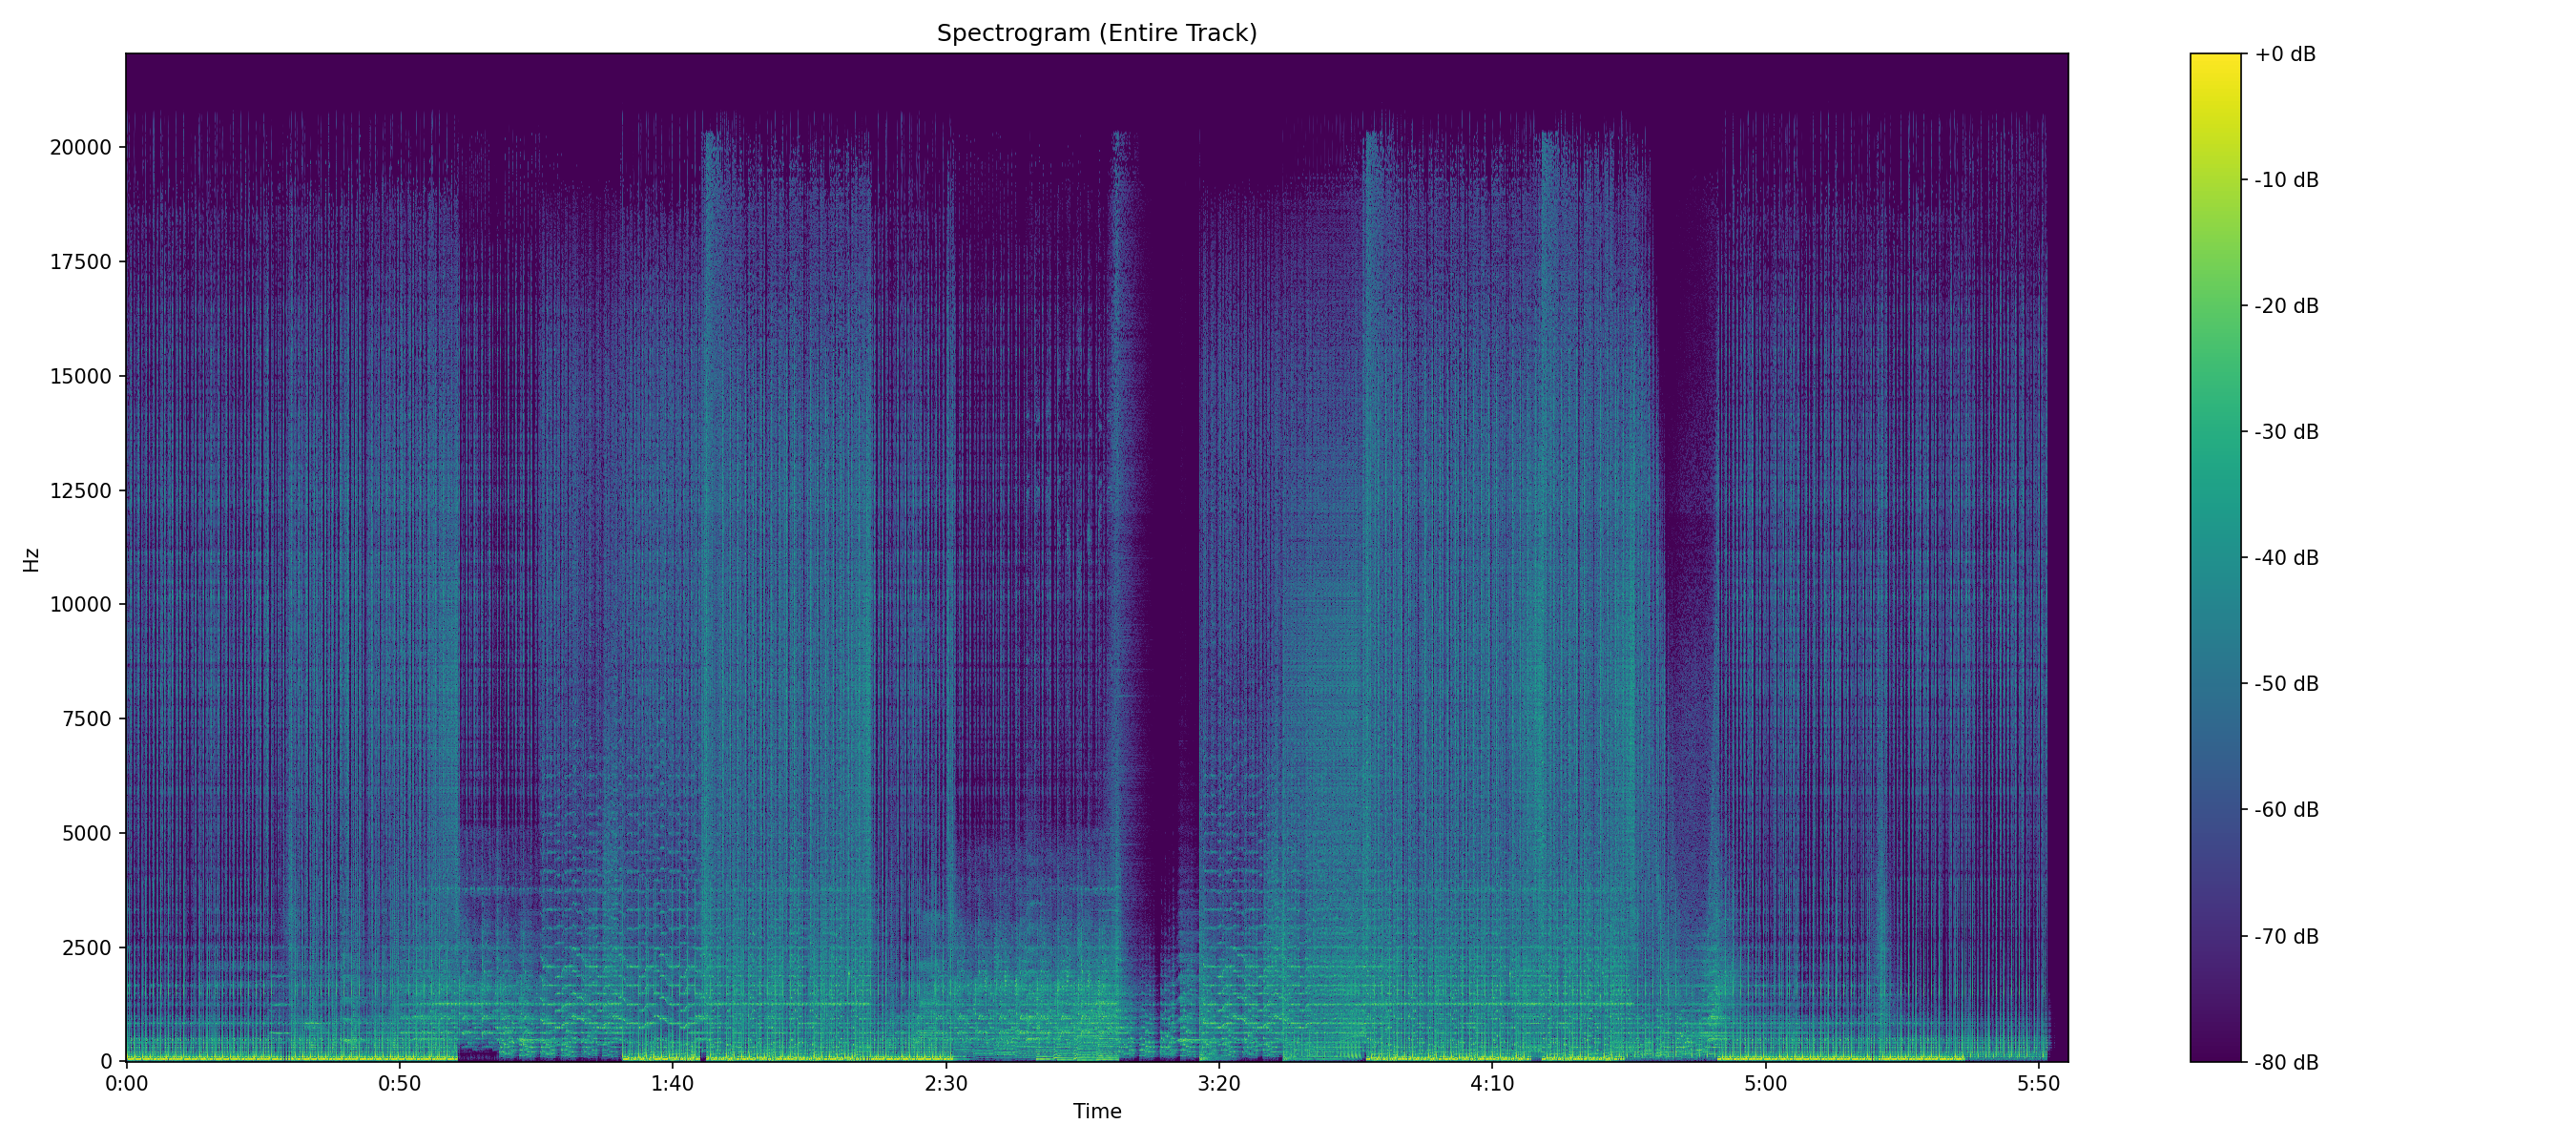
FLAC is lossless, so there's no encoder lowpass to find — the spectrogram should show content right up to the Nyquist ceiling with a ragged, music-following edge. At 44.1 kHz that's a peak near 22.05 kHz and a ratio ≈ 1.0; at 96 kHz, genuine hi-res material shows something — usually noise and harmonics — above 22 kHz into the 48 kHz range.
And here's the thing that makes lossless formats easy: they all look the same. A genuine FLAC, a genuine ALAC, a genuine WAV, and a genuine AIFF of the same recording are bit-identical at the sample level, so their spectrograms are pixel-identical too — content to the ceiling, ragged edge, ratio at practically 1.00. One reference image serves all four, which is why this article shows exactly one lossless spectrogram:
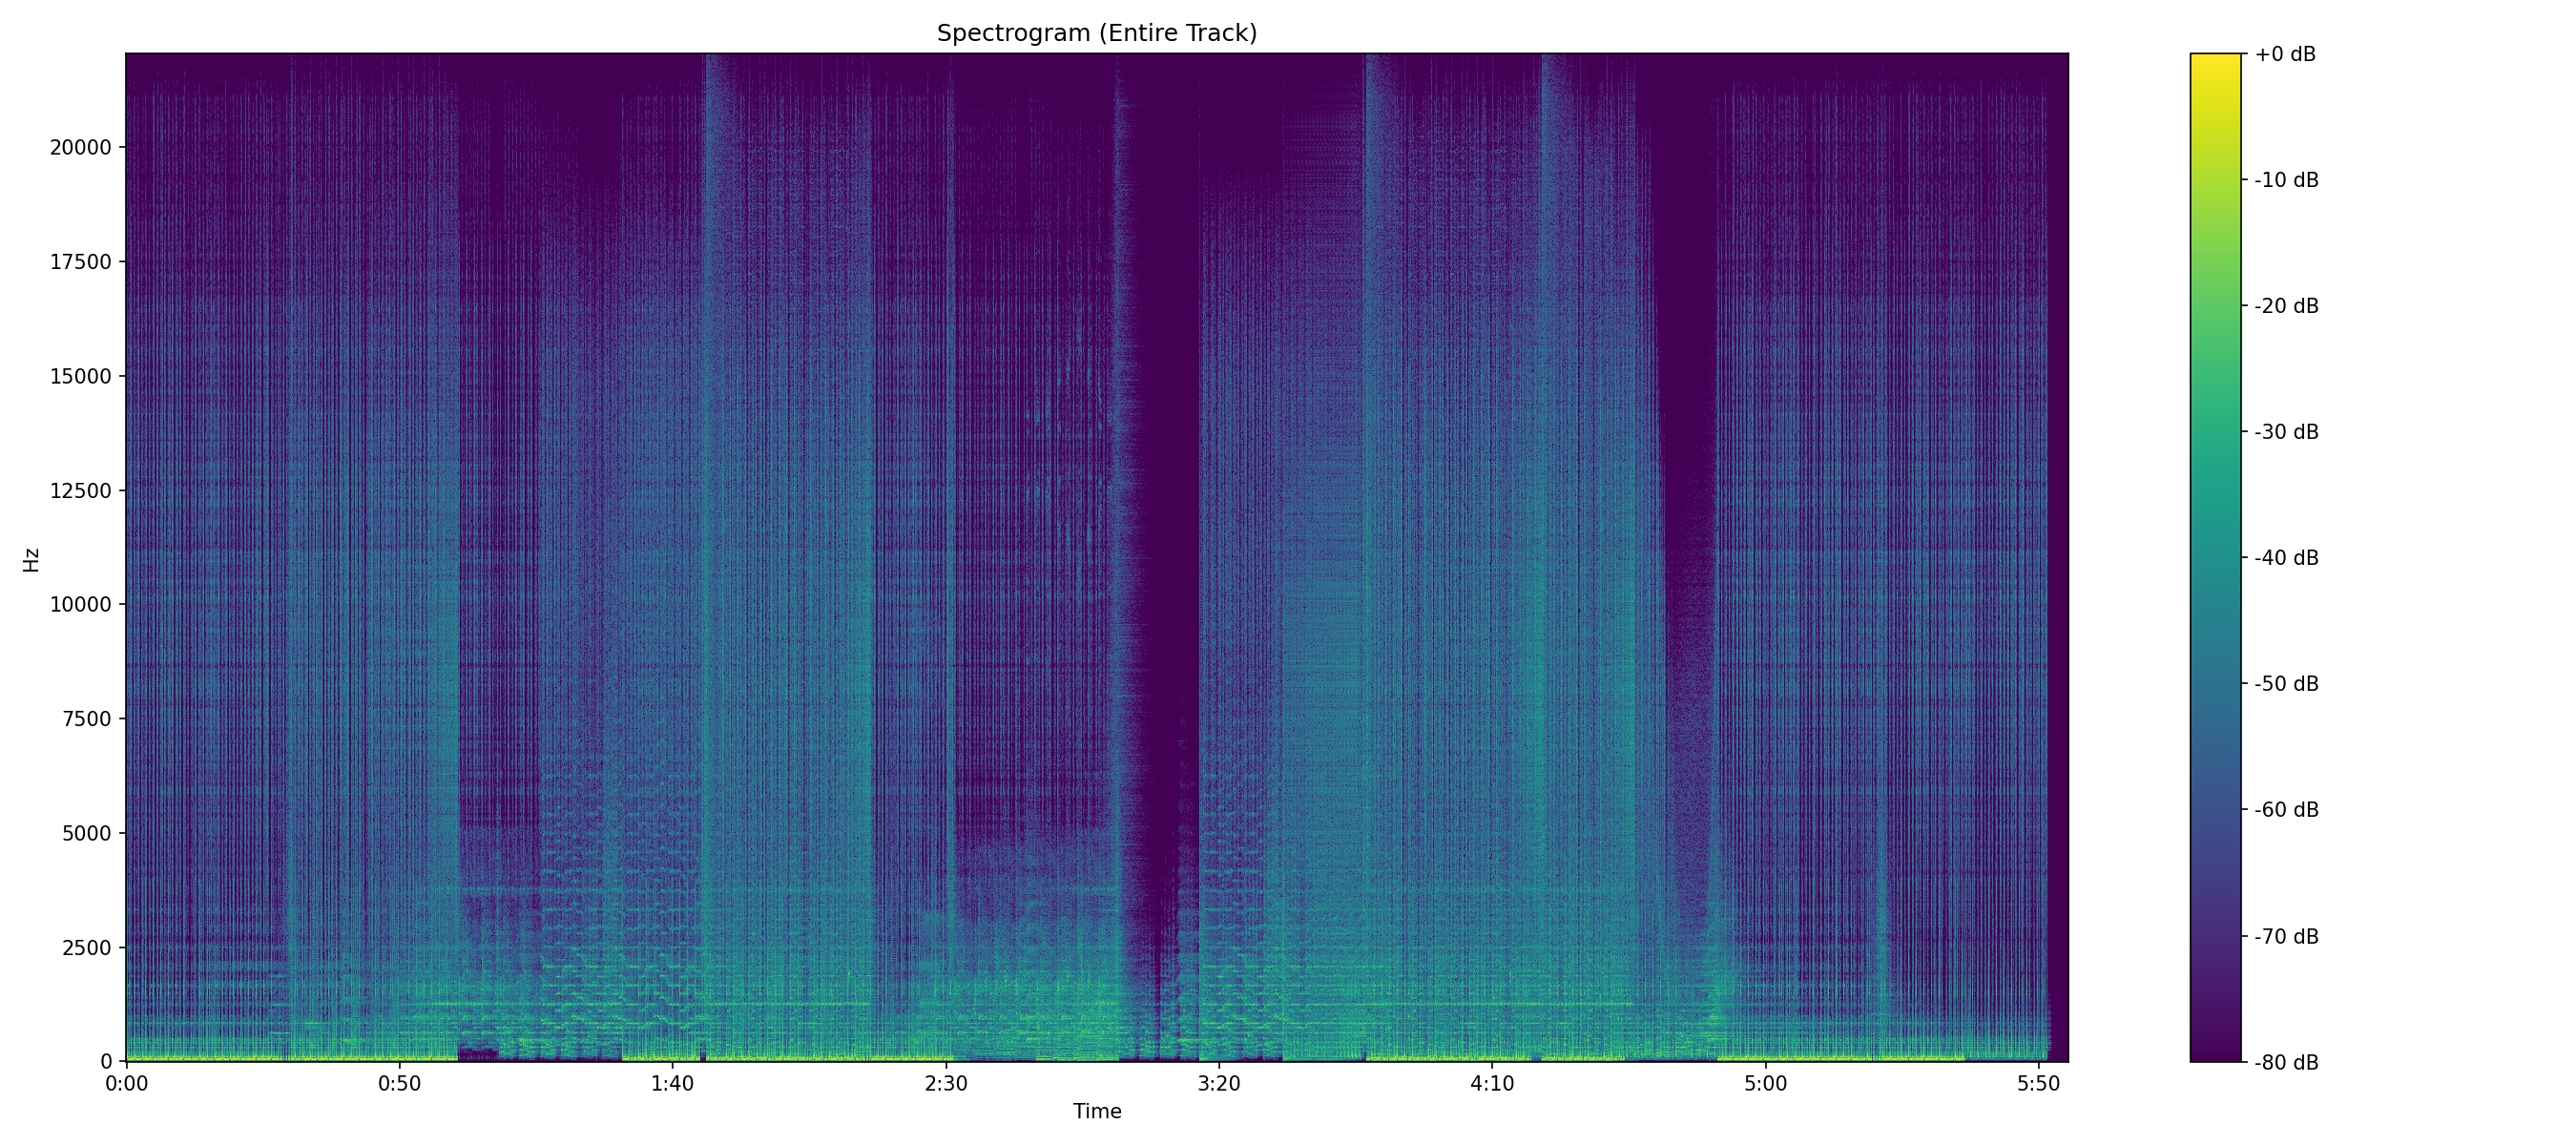
Which means a lossless container's spectrogram is a lie detector for its history, not its format. A shelf at 16 kHz says the file is a transcoded 128 kbps MP3 wearing a lossless wrapper; an empty band above 22.05 kHz in a 96 kHz file says it was upsampled from CD rate. Bitrate corroborates: genuine 44.1 kHz FLACs run ~700–1,000 kbps, and a transcode compresses suspiciously well because the encoder already removed the detail FLAC would otherwise spend bits on. The full five-clue method is in the FLAC verification guide.
ALAC (.m4a)
Apple's lossless codec lives in the same .m4a container as AAC, so the first check is always the codec field: alac means lossless, aac or mp4a means lossy. Once you've confirmed ALAC, apply exactly the FLAC expectations — content to Nyquist, ragged edge, ratio ≈ 1.0, and a bitrate in the 700–1,000 kbps range for 44.1 kHz stereo.
The failure mode to watch is the "upgraded" iTunes library: AAC purchases or low-bitrate imports batch-converted to ALAC by someone who believed conversion restores quality. The ALAC faithfully preserves the AAC's 19.5 kHz shelf, the file quadruples in size, and nothing is gained. The spectrogram catches it the same way it catches fake FLAC — the container upgraded; the audio didn't. And when the file is genuine, it looks exactly like the lossless reference image above — because it is exactly that audio.
WAV (.wav)
WAV is raw PCM with a header — no compression, no codec tricks, nothing between you and the samples. The spectrogram expectation is pure Nyquist: at 44.1 kHz, content to 22.05 kHz; at 96 kHz, content that actually uses the 48 kHz range. The catch is that WAV's honesty as a container makes it the preferred hiding place for dishonest audio: an upscaled or transcoded file saved as WAV is "technically lossless" forever after.
The three failure signatures, each covered in depth in the WAV guide: a 96 kHz file whose spectrum stops dead at 22.05 kHz (upsampled from CD rate — ratio drops to ≈ 0.46); a 24-bit file whose noise floor bottoms out at −96 dBFS (padded from 16-bit); and the classic lossy shelf with its empty band above (transcoded from MP3 or AAC). Every number in a WAV's header is arithmetic, not evidence — the spectrum is the only witness. A clean WAV is, once again, the same picture as the lossless reference above.
AIFF (.aiff, .aif)
AIFF is WAV with a different header — Apple's container instead of Microsoft's — holding the same raw PCM. Everything from the WAV section applies unchanged: content should reach Nyquist, the ratio should sit near 1.0, and all three failure modes (upsampling, bit-depth padding, lossy transcodes) look identical on the spectrogram because they are identical at the sample level.
The practical difference is ecosystem, not analysis: AIFFs cluster in Mac-centric production workflows, so the format shows up often in sample libraries, DJ pools, and bounced project files — contexts where a "production-ready" file may quietly have lossy ancestors. Same suspicion, same checks, same verdicts — and the same lossless reference image when the file is clean.
Putting it into practice
The workflow, once the theory is in hand, takes under a minute per file. Drop the file into the analyzer and note the sample rate — that sets the Nyquist ceiling. Read the measured peak frequency and the ratio. Then, if anything looks off, tick the spectrogram box and check the shape of the top edge: ragged and breathing is music, level and lifeless is an encoder. Cross-reference the ceiling against the master table above to name the likely source codec, and check the debug log attached to every result if you want to see exactly which measurements produced the verdict.
After a dozen files the pattern recognition becomes automatic — the shelf of a 128 kbps past is as recognizable as a fingerprint. And if you want to audit an entire library rather than one file at a time, the open-source version runs the same analysis in batch over whole folders.
Frequently asked questions
Can a file exceed its Nyquist frequency? No — content above Nyquist can't be represented; attempting it produces aliasing, false tones folded back below the ceiling. Recording chains filter above-Nyquist content out before sampling precisely to prevent that. If a file seems to show energy above half its sample rate, what you're seeing is an analysis artifact or a misreported sample rate, not real ultrasonics.
Does a ratio of 1.0 prove a file is lossless? It proves the top of the spectrum is occupied — no more. HE-AAC synthesizes a full-looking band at 48 kbps, and high-quality Opus and Vorbis reach high enough that the ratio alone can't convict them. The ratio is the first filter, not the final verdict; cutoff shape, bitrate, compression ratio and provenance complete the picture.
Why do some genuine files stop at 20 kHz? Because some masters do. Deliberate lowpassing during production, bandwidth-limited vintage recordings, and certain microphone chains all produce honest 20 kHz ceilings. The distinguishing marks are the gradual, music-following edge and the faint noise persisting above it — both visible on the spectrogram, neither visible in a bare ratio.
What about WMA, WavPack, or DSD files? The analyzer focuses on the nine formats above, which cover the overwhelming majority of files in circulation. WavPack and Monkey's Audio follow FLAC's expectations when lossless; DSD is a different physics entirely (1-bit, megahertz rates, shaped ultrasonic noise) and doesn't fit the Nyquist-ratio framework at all. The glossary covers the terminology for the longer tail.
The takeaway
Nyquist is the ceiling the format allows; the measured peak is what the file actually delivers; the ratio divides one by the other; and the spectrogram shows whether the gap was made by music or by an encoder. Four ideas, one minute per file, and no label gets the last word ever again.
See your own files on a spectrogram
Upload any audio file and get its measured peak frequency, peak-to-Nyquist ratio, and a full-track spectrogram in seconds. Free.
Analyze a File